Howdy traders, it’s Bryce here.
The opportunities for small account traders keep growing.
Pay attention right now!
- We’re in the middle of earnings season.
- We’re about to enter the busiest Holiday weeks.
- Markets are still up after a HUGE rally last week.
- The FED paused rate hikes and the job market is cooling.
Bullish volatility is abundant. Yesterday MSP Recovery Inc. (NASDAQ: LIFW) launched 530% intraday. Wrap your head around that …
We don’t have to catch the whole move. It’s much more safe to grab a nice chunk of the middle.
It’s almost impossible to trade these things perfectly. But with the right patterns, we can get in and out before things turn ugly.
Volatility works in both directions. A 530% spike sounds nice … but the stock will likely give up all those gains within the next few weeks.
This is about timing.
We don’t have to stay exposed for long, the trades can be quick. But we have to know what to look for.
Today I’m going to use LIFW as an example and point out key movements.
Then you’ll get to see it happen LIVE …
MSP Recovery Inc. (NASDAQ: LIFW)
The stock originally started spiking on October 26 after the company announced its CEO had purchased 467k shares.
At the time, the value was around $1.15 per share, equating to $537k.
If a CEO buys shares of the company, it’s a huge vote of confidence. Especially for penny stocks.
These companies aren’t viewed as valuable. That’s why the share price is so low. Thus, when the CEO buys $500k worth of shares, that draws a lot of attention.
“AI Weatherman” Uses Strange Forecasting System to Predict Stock Moves
They call this new tech “The AI Weatherman”…
Because it can forecast the future moves of stocks like a weatherman would predict weather…
…With downright scary accuracy…
How does it do it?
Well, it’s all thanks to a unique stock scoring system unlike anything I’ve ever seen before…
Prices spiked 180% as a result. But the real move came yesterday, November 6.
The price had been consolidating for a few days underneath the breakout level. Yesterday, prices smashed through that level and extended the total spike to more than 1,400%.
And this isn’t meaningless volatility.
Take a look at the chart …
Daily Breakout
Stocks like to move between areas of support and resistance.
The specific levels for each stock are determined by a combination of …
- Past price action.
- Intense periods of buying and/or selling.
- Psychology.
- In people’s minds, $1.00 is much more significant than $1.37.
We can see these levels on the chart and it helps us plan our trade strategies.
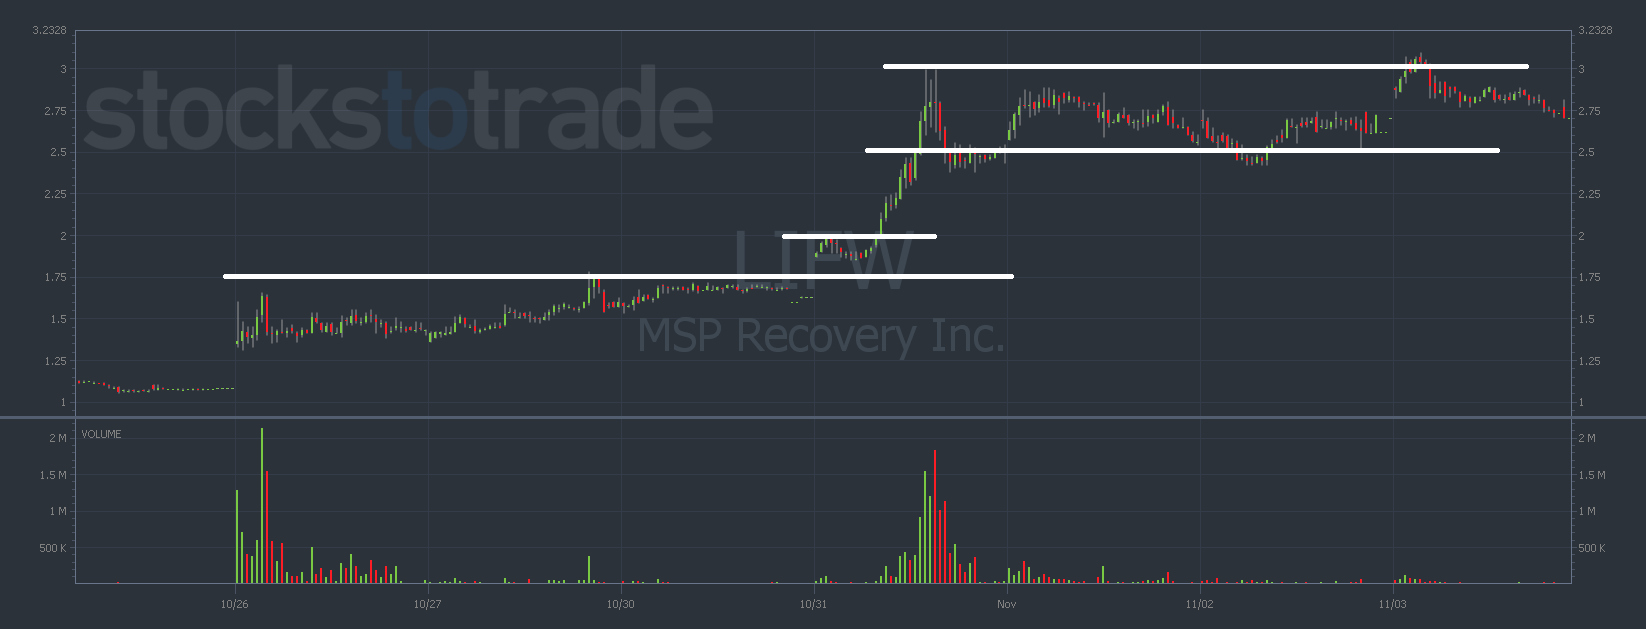
Take a look at this chart of LIFW after it spiked on October 26 (excluding yesterday because the volatility throws off the chart proportions). I drew in the levels …
LIFW chart 15-day, 10-minute candles Source: StocksToTrade
From top to bottom, there are levels at …
- $3
- $2.50
- $2
- $1.75
Technically I could add lines for $1.50 and $1.25 but I didn’t want to crowd the chart too much.
Notice how the price action moves between these lines. And notice how psychologically significant the dollar amounts are.
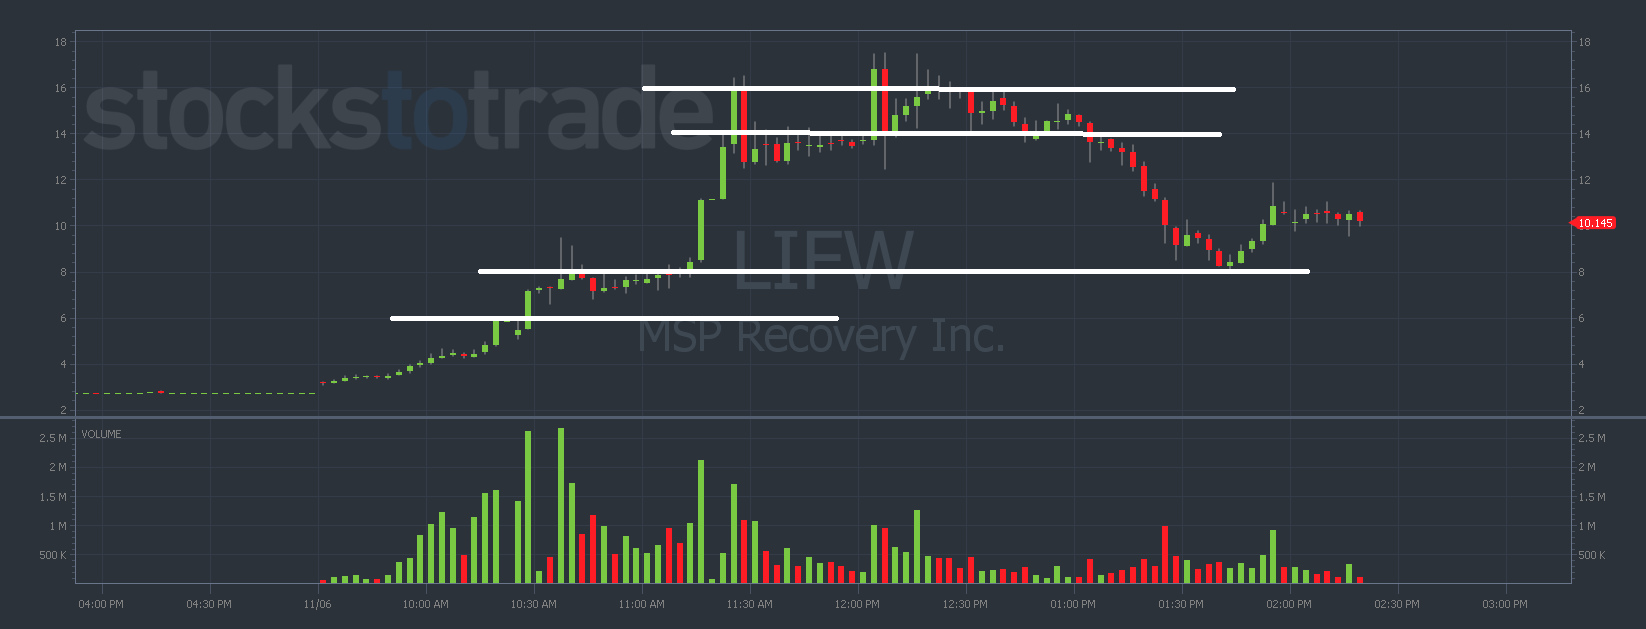
Now … on Monday, November 6 LIFW broke out over the $3 level. Look at the chart below with support and resistance levels …
LIFW chart 2-day, 3-minute candles Source: StocksToTrade
The chart shows 3-minute candles, which means there’s less intraday detail. There are more support and resistance lines intraday but again, I didn’t want to clutter the chart.
From top to bottom, there are lines at …
- $16
- $14
- $8
- $6
Coincidence? I think not.
How To Capitalize
You might have noticed that the price behaves differently between each of the lines.
This isn’t a one-size-fits-all approach.
We need to trade different patterns based on the price action, but the support and resistance lines are common throughout all the stocks that we want to trade.
There are likely still trade opportunities on LIFW. But don’t limit yourself to one stock. Yesterday LIFW spiked 500%. Today it could be a different ticker.
Make sure you’re …
- Watching the right stocks.
- Using the right patterns.
If you have ANY confusion about this … Don’t make a trade until you’ve watched a live trading demonstration.
In this industry, you don’t know what you don’t know until it’s too late.
We’re putting together the hottest watchlists every single day and we’re outlining every trade strategy.
Protect your account and take your trading to the next level. Here’s the link.
Cheers.


