Hey traders, it’s Matt here.
There are profit opportunities every week for traders in our community.
But a lot of new traders don’t know how to approach these setups.
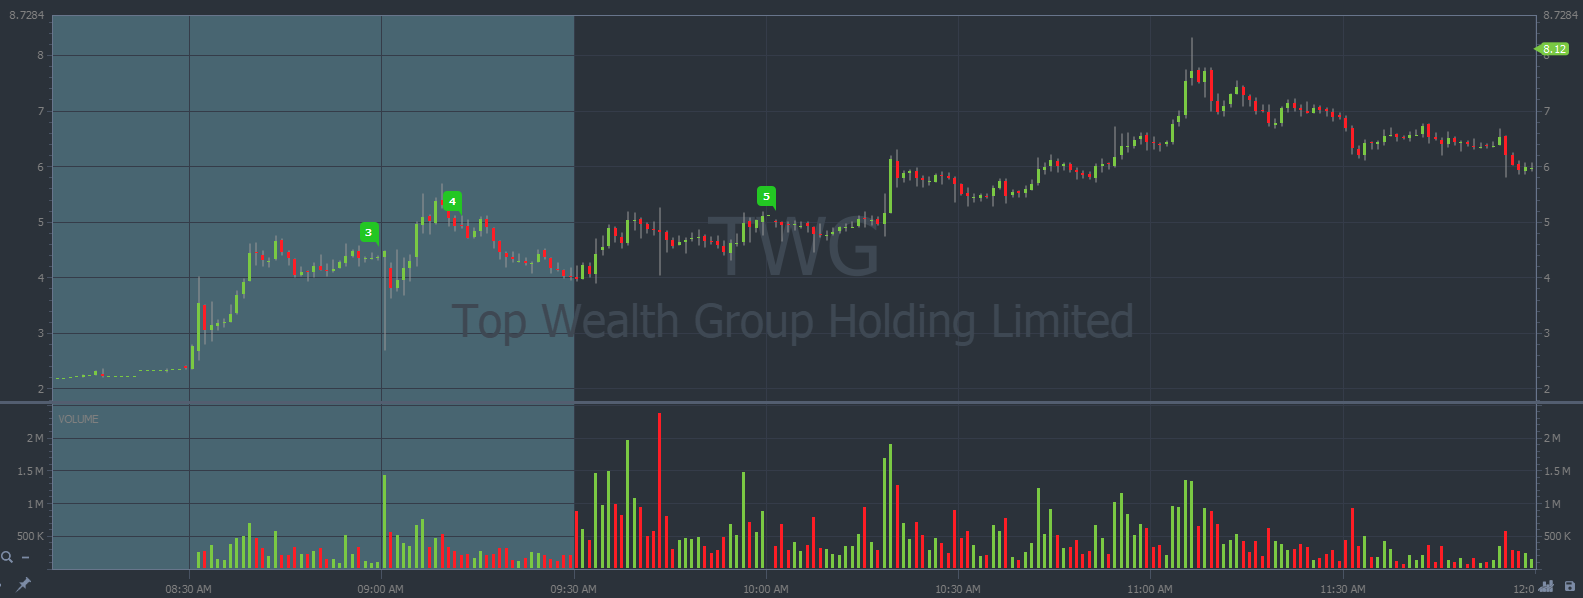
For example, let’s use the 300%* spike from Top Wealth Group Holding Limited (NASDAQ: TWG) on Friday, October 11.
Take a look at the chart below of the move from Friday morning. See if you can pick out a profitable setup …
TWG chart intraday, 1-minute candles Source: StocksToTrade
For veteran traders, the setup above is glaring.
But again, new traders might not recognize this profitable price action. And even if they do … Hindsight is 20/20. When a trader is in the moment, there are a lot of uncertainties and emotions that can lead to poor trade decisions.
In today’s blog, I’ll show you how we trade runners like TWG.
It’s not the first or last stock to follow this pattern … There will be opportunities like this in the coming week.
Profitable Entries
The biggest mistake that new traders make: They get excited and buy shares too early.
When the market opened at 9:30 A.M. Eastern, TWG had already spiked 80% and announced an upcoming public offering scheduled for October 14. The company is set to publicly release 27 million shares at $0.40 per share for gross proceeds of $10.8 million.
It had a good catalyst and the chart showed us a lot of good bullish momentum. But in the first 45 minutes of the day, all we got was sideways chop.
For traders who are too eager … That’s dangerous price action.
Instead, experienced traders wait for the chart to fit one of our patterns.
Here’s the real play from TWG last Friday:
Key Support Levels
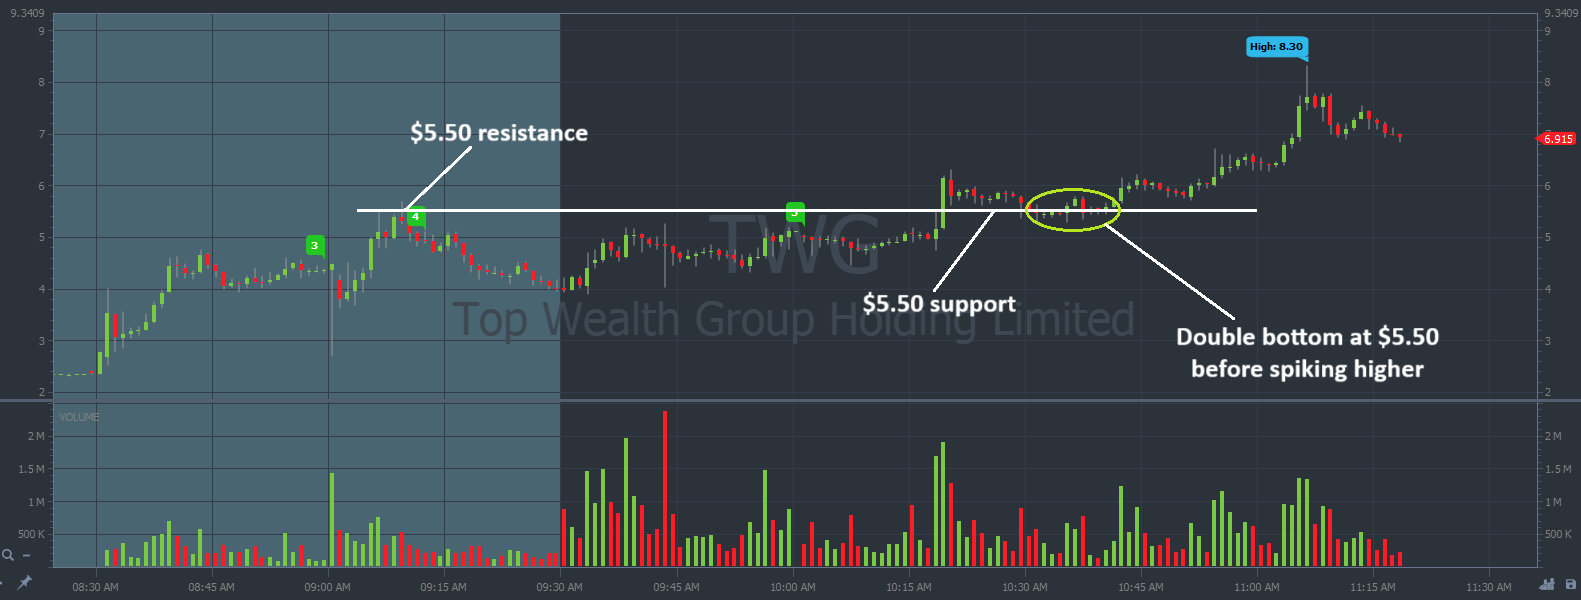
On the intraday chart below, you can see TWG spiked to $5.50 during premarket.
Then, when the market opened, TWG eventually spiked past $5.50 and consolidated above that level to spike even higher.
That consolidation is our bread and butter!
Ideally, a trader would have built a position around $5.50 with a small risk margin. Then, the goal is to ride the price higher.
In this case, holding the stock from $5.50 to $7.50 would have been a 30% trade. Take a look at the chart below, every candle represents one trading minute:
TWG chart intraday, 1-minute candles Source: StocksToTrade
Remember that resistance can turn into support and vice versa.
This was such a great setup!
And we see stocks that move like this every week in our niche.
New traders even get to use artificial intelligence to track this price action!
Over several months, we taught an AI bot to follow our specific trading patterns.
Since it’s the same patterns over and over again, it was only a matter of time until the AI caught on!
>> On Monday, prompt our AI bot with the hottest stock in the market <<
It will spit out a trade plan as if you asked us directly!
Understand, random positions will give you random results. Take this seriously.
Use AI to confirm your trade thesis.
Cheers,
Matt Monaco
*Past performance does not indicate future results


