Hey traders, it’s Matt here.
The volatility is growing in this market.
That translates to larger profit opportunities traders like you, me, and Bryce.
Here’s an example of the crazy volatility right now:
We watched NVIDIA Corporation (NASDAQ: NVDA) spike higher after its earnings report from the week before.
And contrary to most expectations … The market didn’t spike in tandem. Major indices experienced substantial dips last week. Until Friday, when the price action bizarrely reversed.
Take a look at the chart of NVDA’s spike below, every candle represents one trading minute:
NVDA chart multi-day, 1-minute candles Source: StocksToTrade
And here’s a chart of the S&P 500 ETF Trust (NYSE: SPY) index over the same time period:
SPY chart multi-day, 1-minute candles Source: StocksToTrade
Now, for investors, this is a nerve-racking moment in the market.
There’s no way of telling which way the market moves. And we can definitely recognize a growing volatility that no longer follows the bullish tech momentum …
But for small-account traders, this is one of the best markets since the 2020 – 2021 bull rally.
The volatility is inspiring HUGE stock runs in our niche.
One of the spikers we saw last week launched 230%* in less than 24 hours.
Now, we’re not trying to take the entire move. The idea is to pull strategic profits. Then we move to the next runner …
Small-Cap Volatility
Volatility can be scary if a trader doesn’t understand the framework behind these moves. There are real dangers when it comes to trading.
That’s why we only focus on the best setups.
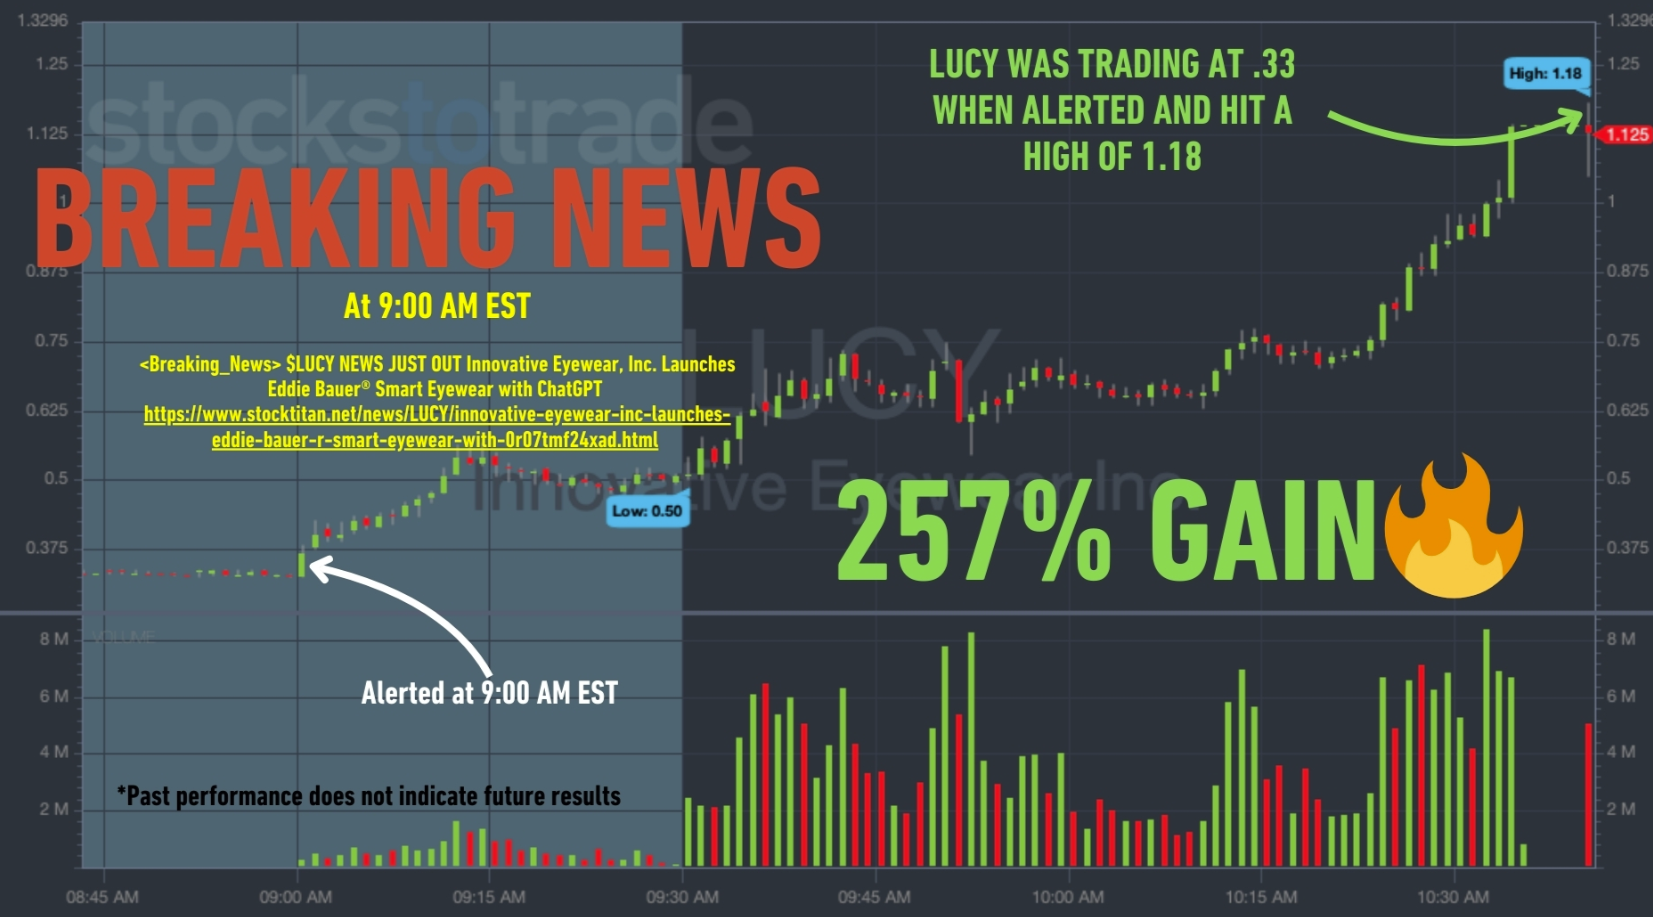
The 230% spike from last week … We had eyes on it right when it started to move.
Innovative Eyewear Inc. (NASDAQ: LUCY) announced its plans to launch an Eddie Bauer line of glasses with a voice XGPT system embedded.
Most traders were late to the move. Unless they were watching the Breaking News scanner.
We got a trade notification during pre-market trading hours. And traders had ALL DAY to build a position.
Take a look at the alert overlaid on the chart below. Every candle represents one trading minute:
LUCY chart intraday, 1-minute candles Source: StocksToTrade
Don’t waste time scouring the market for good trades:
>> Watch for the next Breaking News trade alert <<
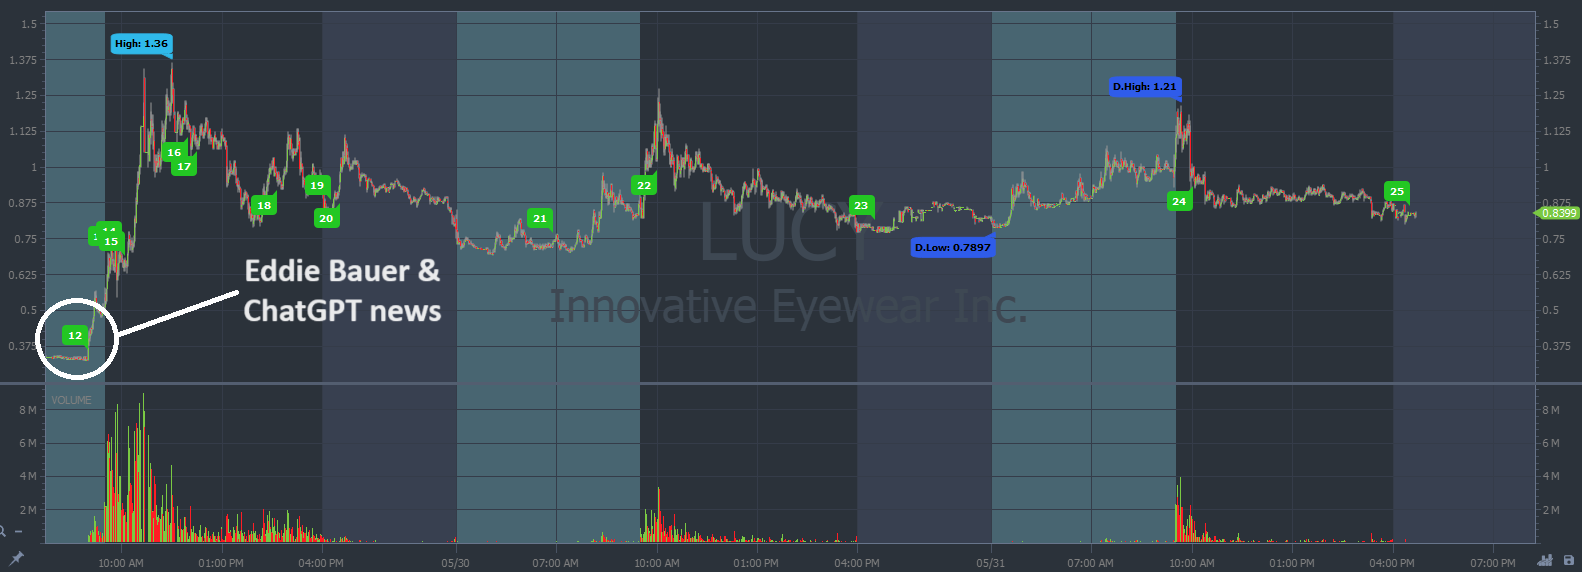
And don’t forget about LUCY on Monday …The chart is still consolidating after last week’s spike.
Take a look at the chart below, every candle represents one trading day:
LUCY chart multi-day, 1-minute candles Source: StocksToTrade
This stock could push higher this-coming week!
- It has a viable catalyst related to AI.
- The float shows a low supply: Only 8 million shares.
- A low supply helps prices spike higher when demand increases.
Follow the framework that we use to trade these runners.
Get ready for more volatile stock moves tomorrow!
Cheers,
Matt Monaco
*Past performance does not indicate future results


