Key Takeaways
- Reviewing PPSI’s parabolic December 8 run…
- How to identify developing trends…
- Knowing when to jump in the trade…
Hey, all. Bryce here!
I recently wrote about the benefits of trading in hindsight — or, to simplify, reviewing old trades.
It’s a great way to determine what you would have done had you better understood the move. And it’s something that improves the more you trade.
Earlier in December, I reviewed Pioneer Power Solutions, Inc. (NASDAQ: PPSI) for the SteadyTrade Team. I also talked about it on Small Cap Recap…
Had you been ready for it, this could have been a killer trade.
Let’s break it down…
PPSI: The Setup
First, let me tackle why this was such an interesting trade…
I saw clear resistance and support in the chart developing in late November and early December.
Zoom in and you can spot an uptrend forming. That could have pushed PPSI to its first key area of resistance.
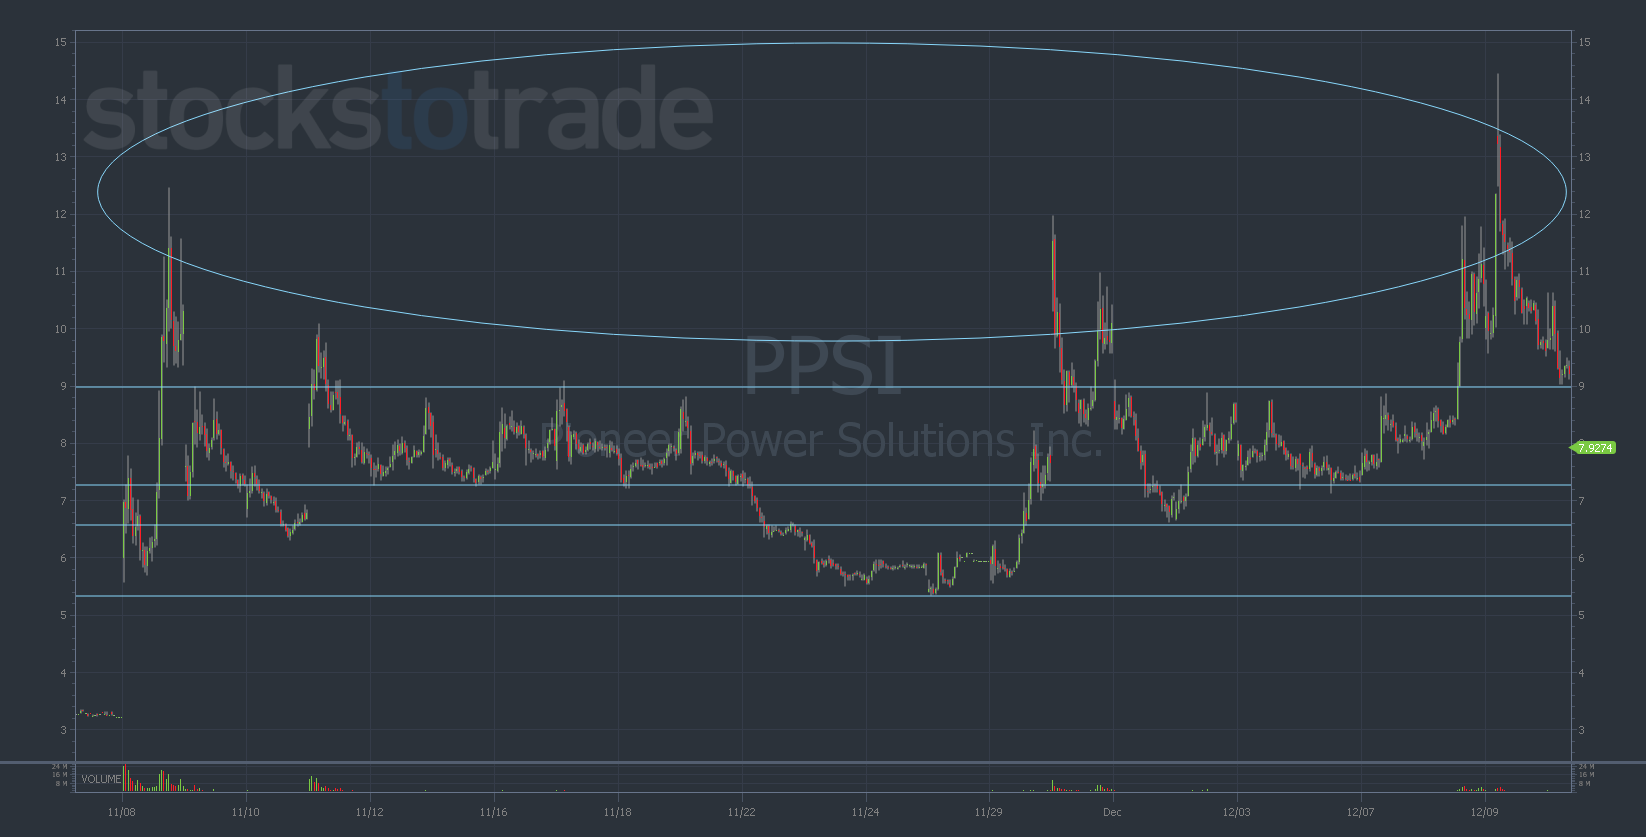
PPSI setup (Source: StocksToTrade.com)
Note the pattern forming on the chart — a cup and handle. That’s bullish.
Here’s a great opportunity for a question: How do you know the pattern will be a cup and handle when it hasn’t fully formed yet?
Well, one formed earlier in the multi-day time frame, signaling a larger pattern in development. Remember to look at multiple time frames with your charts.
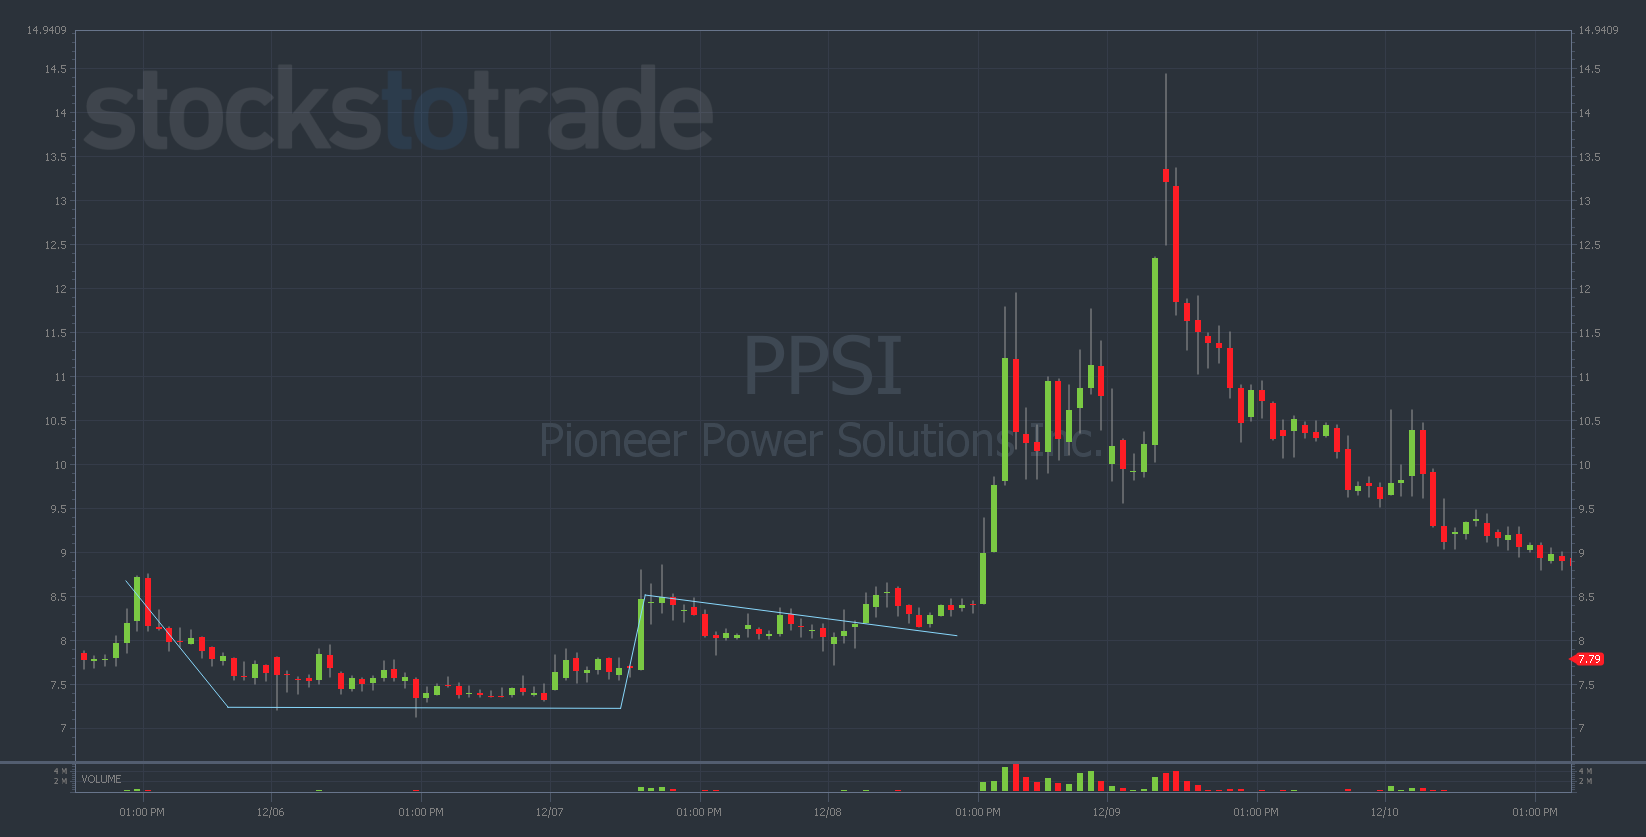
PPSI cup and handle (Source: StocksToTrade.com)
How to Know When to Jump In
The cup-and-handle formation was a HUGE signal that PPSI had the potential to gain over $1 per share.
Check Out This Recent Alert From the “Small Cap Rockets” Trade Room...
✅ Entry & exit points on low-priced stocks….
✅ Up-to-date market insights…
✅ Commentary on specific trades…
Plus, bullish descending triangle breakouts earlier in the multi-day chart gave me confidence in a potential run.
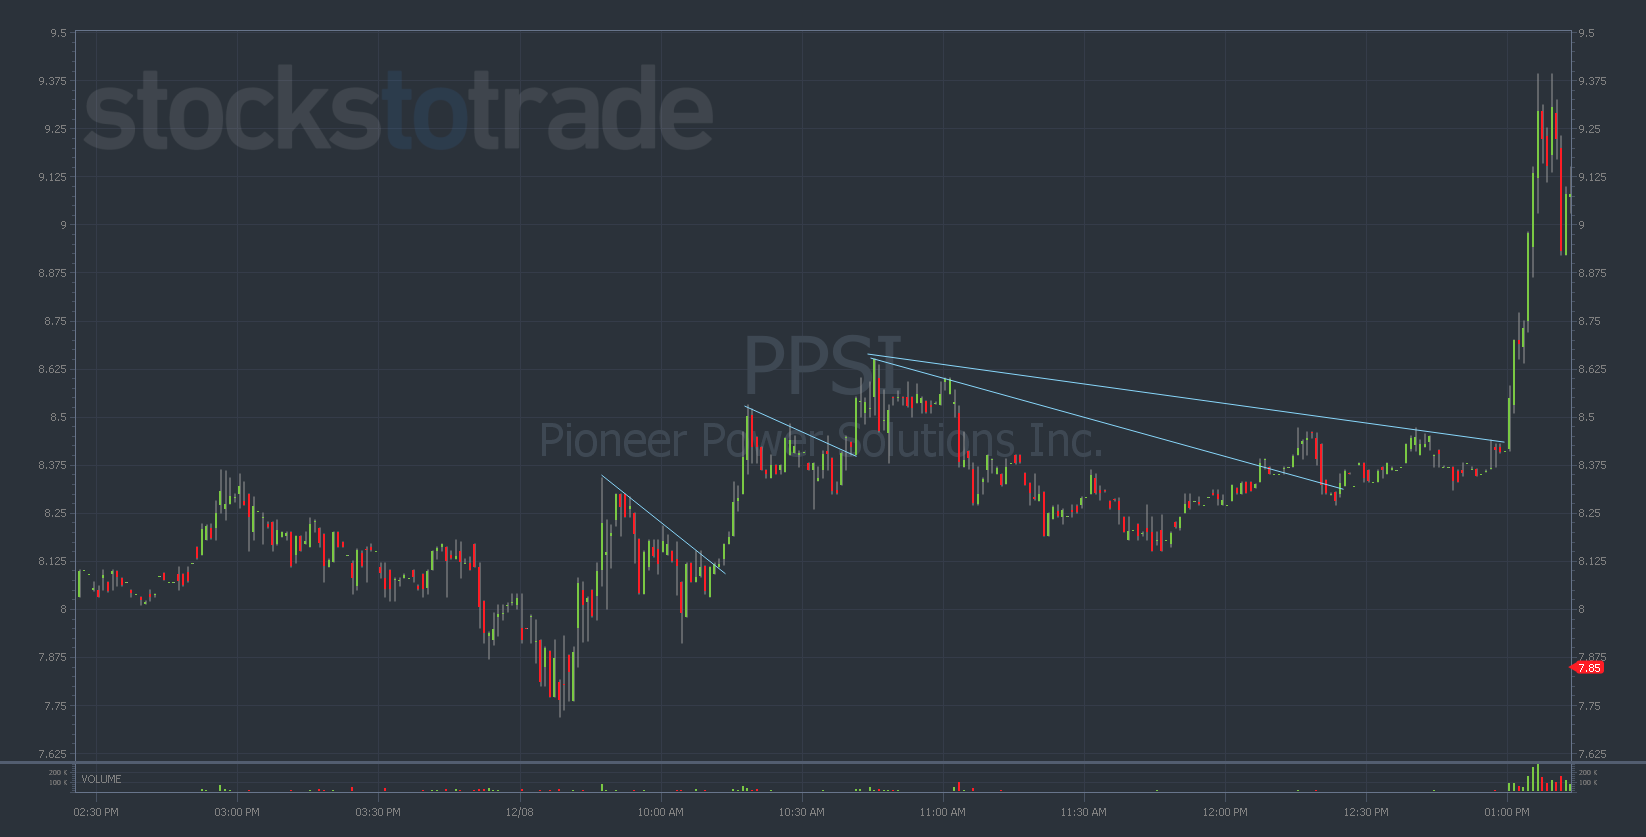
PPSI triangle (Source: StocksToTrade.com)
After that, PPSI set a new trend. A strong line of support was set at $8.25.
The resistance at $8.45 also acted as a pretty good entry point. Once it hit that, it didn’t take long for it to explode from there, rocketing 42% higher in less than two hours.
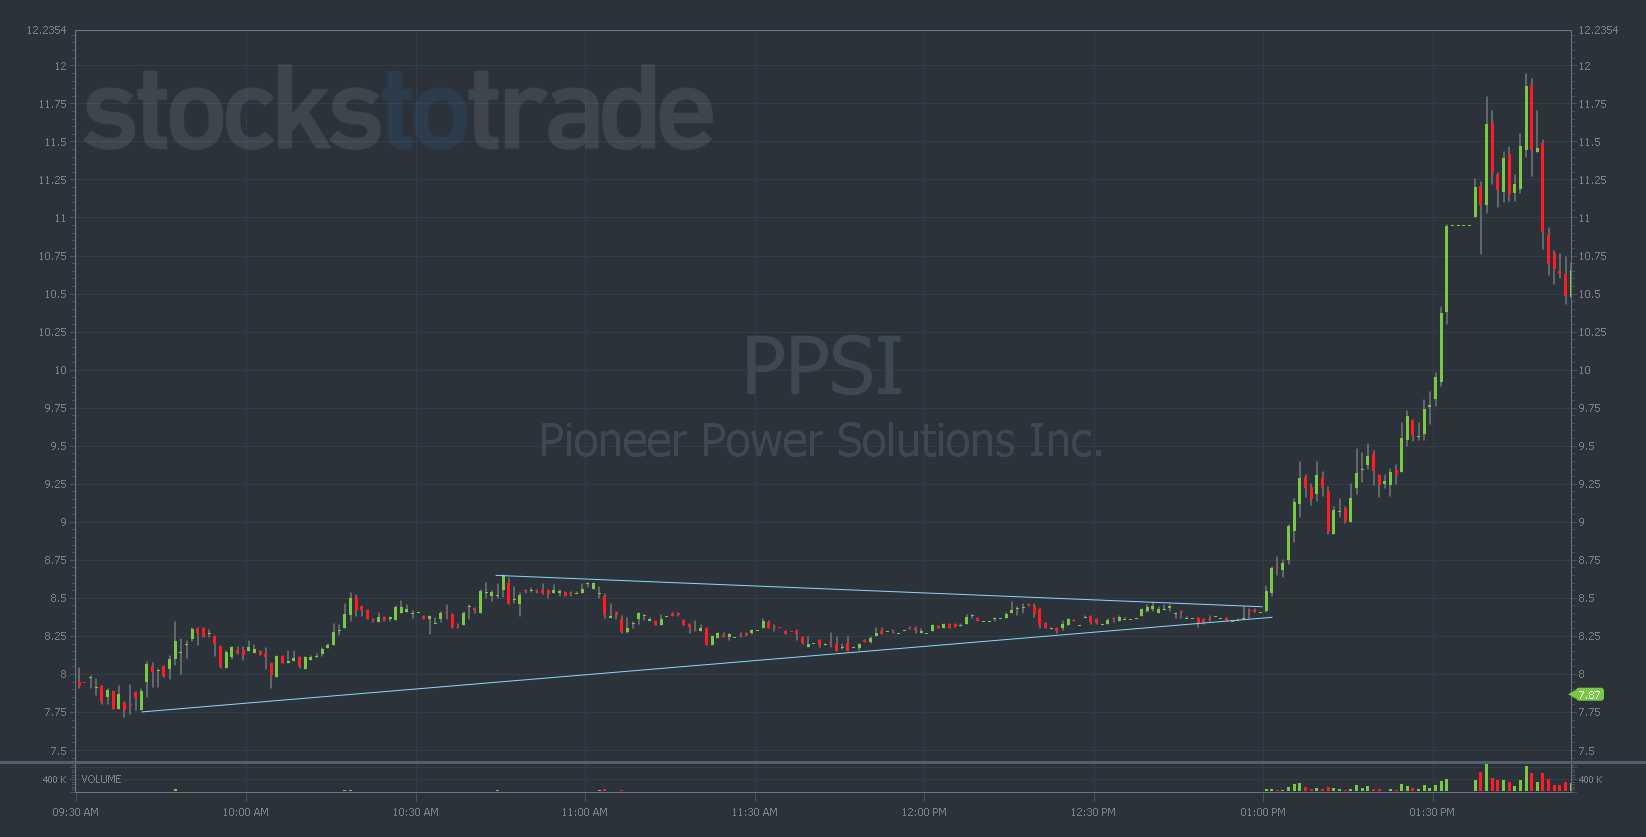
PPSI explosion (Source: StocksToTrade.com)
I really wanted to see this break and hold the $8.80s. If it did that, anywhere in between $9.10 and $9.50 acted as a good target.
As you can see, it fell nicely into that range — jumping to $9.40 in that first run.
After the initial jump, momentum carried it even higher than I expected.
I expected a halt after that quick 10% pop. And when no halt came, I thought it would break down pretty quick.
But PPSI quickly regathered and shot up for that huge move.
Conclusion
Sometimes trades are quick and easy. But this December 8 move from PPSI shows how much goes into finding a good setup and developing trends.
There will be small cues in the multi-week and multi-day charts that could suggest a larger move coming.
Pairing those cues with intraday trends makes it easier to identify these opportunities.
After that, you still must set strong risk/reward levels. And try not to let FOMO creep in if it runs 30% past where you thought it would go…
But that’s what’s great — and terrible — about hindsight trading … You may face regret, but it also can make your next trade that much easier.
Stay the course,
Bryce Tuohey