Hey traders, it’s Matt here.
Last week was a whirlwind for U.S. stocks …
Just take a look at the S&P 500 ETF Trust (NYSE: SPY) chart below, every candle represents one trading day:
SPY chart multi-month, 1-day candles Source: StocksToTrade
But the most revealing catalyst is still in front of us.
This week the market is scheduled to receive specific data that could cause a massive market rebound OR another selloff.
For traders like you and me, it’s important to understand why the market is moving the way that it is. Because historically …
- A bullish market creates more profit opportunities.
- A bearish market gives us fewer opportunities
My mentor, Tim Sykes, posted a blog detailing the cause of the market crash last week. But this week there’s a new catalyst about to hit the U.S. economy as a whole.
That’s right, everyone is waiting for this data:
- Traders
- Investors
- The FED
- Economists
- Even your grandmother!
This week we’ll see one of the most pivotal moments in the U.S.’s fight against a recession.
It all comes down to this!
- Will the market rebound?
- Will it continue lower?
Get ready, I’ve got all the details in today’s blog.
The Next Market Swing
No one knows what’s going to happen in the market … That’s what makes it exciting.
If you’re reading this, I can only assume that you have an interest in the stock market. Like me and Matt.
There’s trillions of dollars changing hands every day, catalysts left and right that influence price action, and we get to watch!
Plus, those who understand Sykes’ framework have more opportunities …
But there are a few intricacies of the market that a trader needs to know before they can profit effectively. For example:
Three out of four stocks follow the market.
When the market is bullish, we see more trade opportunities (as long-biased traders).
When the market is bearish, we have to protect our account from losses.
And the catalyst this upcoming week has the potential to push the market one way or the other. Consequently affecting our trade setups.
On Wednesday, August 14, at 8:30 A.M. Eastern, the market will learn the CPI data for the month of July.
The Consumer Price Index (CPI) is a popular way of measuring inflation in the U.S. … And data that shows cooling inflation could lead to a sizeable interest rate cut from the FED.
That’s what we want! The market wants lower interest rates because it makes it less expensive to take out loans and expand business operations.
Lower interest rates could cause a HUGE bullish explosion of stock market volatility.
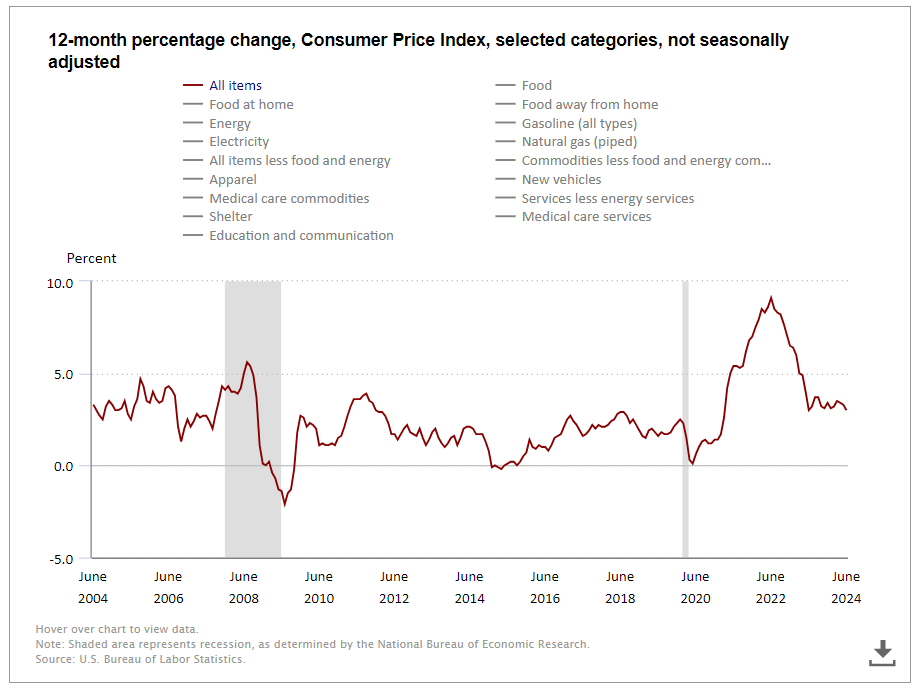
In July, we learned that June’s CPI measured 3% … See the chart below:
(Source)
Our goal as an economy is to bring that number between 2% and 3% … Last month’s 3% announcement was so close!
What Happens Next?
We’re still playing the exact same trade setups.
But the strength of the market will determine whether we put the pedal to the metal or approach these plays more cautiously.
Follow along this week LIVE as we map out the hottest profit opportunities during a market on high alert.
We’re not trying to predict which way the market will run. Instead, it’s much more safe to react to the volatility.
There will be enough time after Wednesday’s announcement to build a position. You just have to know what to look for.
Don’t worry, new traders can use our AI trading bot right now to track the best trade patterns on the hottest stocks!
You’re not alone in this market, Bryce and I are here to help!
Take advantage of our trading expertise while you grow in the market.
Bryce and I had Sykes to help us. And now you’ve got the two of us to help you!
Cheers,
Matt Monaco
*Past performance does not indicate future results


